Where are we at today? Understanding our impact.
-
Let’s talk about the Status Quo and where to go from here
During a time of crisis, in which the live music industry is amongst the hardest hit sectors, it might be difficult to think about restructuring and tackling the “next” crisis. Nevertheless, the climate emergency isn’t going anywhere. In my recent blog post I talked about how the Covid crisis has given us a glimpse of a better environment, while making us gain experience, that will be vital in building resilience and adaptation to climate change. Therefore, in my opinion, it is important to discuss a green rehabilitation of the music industry at this time. So in today’s article and throughout the following weeks, I wanna talk about several aspects revolving around the topic of “Green Touring”.
-
“How do you balance a commitment to touring and performing live with the perhaps more universal duty to live in a way that’s environmentally sustainable?” Thom Yorke, 2008
-
Commitment, Understanding, Improving.
These are the 3 organisational principles for taking climate action, as defined by London-based charity Julie’s Bicycle. Committed we are, now to the tools for understanding the impact of touring. According to Fine Stammnitz 2019, a survey of the total carbon emissions caused by the global music industry hasn’t yet been conducted. This is probably due to the complexity of data acquisition in this field as well as it’s less significant share, compared to bigger polluters like the energy- and transport sector. Though, there are a couple of small-scale case studies tracking emissions in the context of music production and touring.
-
case study: UK market
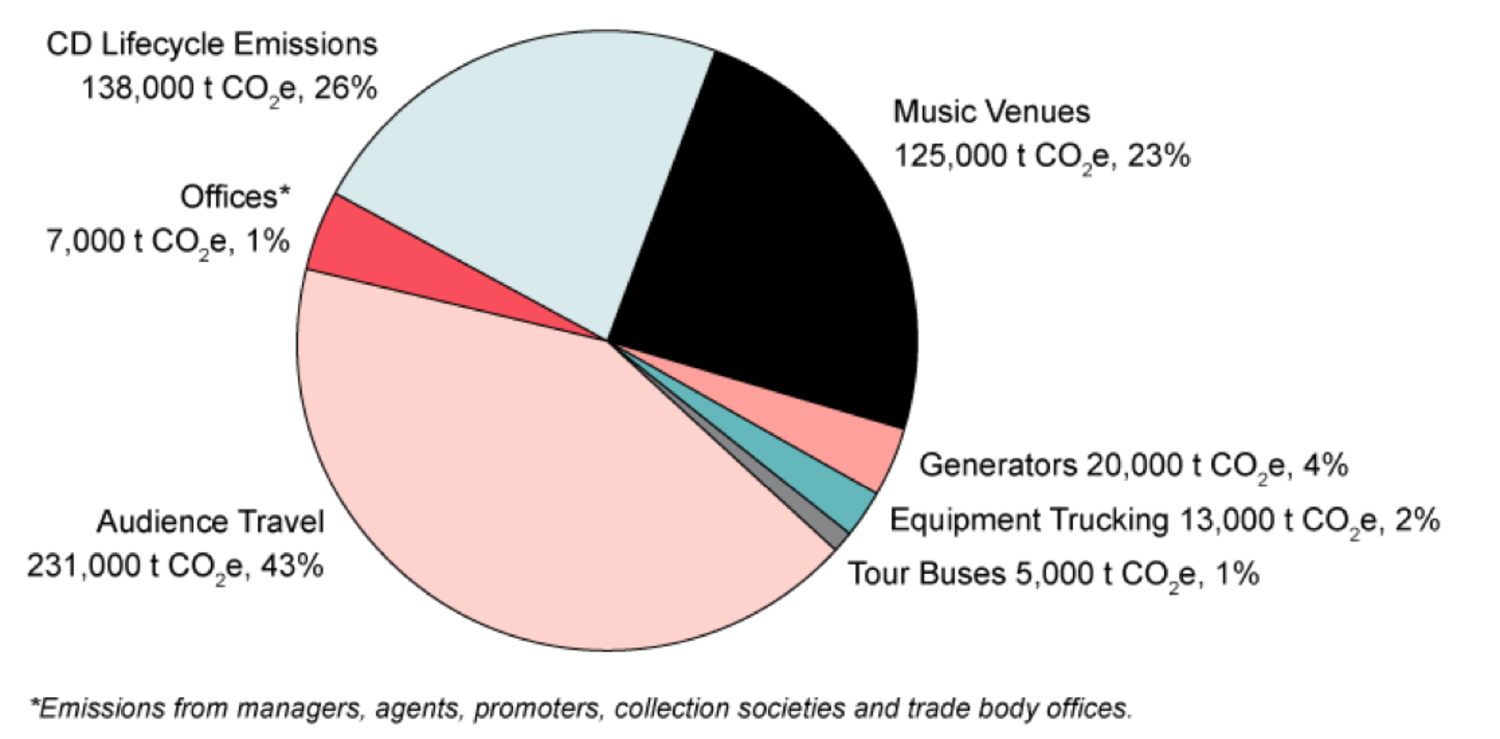
An Oxford study from 2010 estimated that the UK music market alone accounted for roughly a minimum of 540.000 tonnes of CO2 emissions annually. “Approximately three-quarters of the industry’s GHG emissions are attributable to the live music performance sector and approximately one-quarter to the music recording and publishing sector.” (C Bottrill et al 2010)
 GHG emissions per annum from the UK music market: recorded and live performance totals at least 540 000 t CO2 e (C Bottrill et al 2010)
-
A closer look on touring
Now that we’ve gotten a rough estimate of how big of a chunk can actually be traced back to live music performances and touring, I wanna take a closer look at the percentage distribution within that part of the music world.
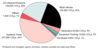
In collaboration with German university Popakademie, the indie band We Invented Paris found that roughly a third of emissions from their 2014 Europe tour came from audience travel and another third from the venue’s power consumption.
Concluding that artists alone cannot achieve sustainability without the common effort of everyone involved in bringing performances to the stage.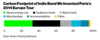
-
Measuring and reporting.
These studies mentioned above made me curious and motivated to dig into our own numbers for the Milky Chance shows. There are plenty of online tools available to help measure and report on one’s carbon footprint, eg. Julie’s Bicycle is offering a free online tool designed specifically for the creative market. “The tools make it easy to measure your energy use, water consumption, waste generation and recycling, travel and production materials. Then use your results to inform your environmental strategy and organisational priorities.”
Sounds pretty straight forward right?
Meaning, if you’ve got the numbers to feed the tool with.
This is where the real obstacle of this undertaking quickly became very obvious to me: the above mentioned complexity of data acquisition.
It’s quite difficult to gather enough data from past shows in order to calculate realistic carbon emissions, even for a single show. There are so many variables to consider, eg. guessing percentages for fan travel, waste production and good luck with getting specific data on eg. water consumption for that exact evening of your show from a venue. Impact ratios for a total estimate of 8t CO2e (Milky Chance show in Munich 2018)
 -
Here is a question for you:
What do you think, how many people (in %) arrive to concerts...
1) by car
2) by public transport
3) by bike or by foot?
Leave your guess in the comments. -
Musicians on the road don’t typically tour with the intention of writing a scientific paper about it afterwards right?
What I’m trying to say is, the estimates I’m showing in the diagram above can only be interpreted as a rough idea of what the distribution probably looks like, never an absolute truth. What they’re supposed to offer is a vague guideline informing the next moves towards the third step: Improving. -
Now that we’ve talked theory and numbers, bear with me.
Next time I will share some suggestions on how to take action and really start heading towards the goal of sustainable “green” touring.